Clients:
AWS IoT - Core
AWS IoT - GreenGrass
Microsoft - Business Intelligence
AWS IoT - Core
AWS IoT - GreenGrass
Microsoft - Business Intelligence
Contains fictitious dashboard designs. The bulk of my work falls under NDA and can only be reviewed upon request.

I have been responsible for structuring and crafting user experiences for Microsoft and AWS. This page contains examples of fictitious dashboard designs to illustrate and gain a feel for UI/UX, thought process and multi-level structuring. Unfortunately, the bulk of my work falls under NDA.
- The sheer volume of data and making sense of it without being overwhelmed.
- The different level of complexity, various data types, formats, multiple dimension and pivots that comes with big data.
- Asking the right questions and surfacing valuable insights to take action which could include data visualization as part of a solution.
- Every industry has its own terminology and vocabulary to familiarize and understand.
- Understanding how one service can connect to many and how they communicate and work together to produce an end result.
Examples are not a direct reflection of past dashboards.

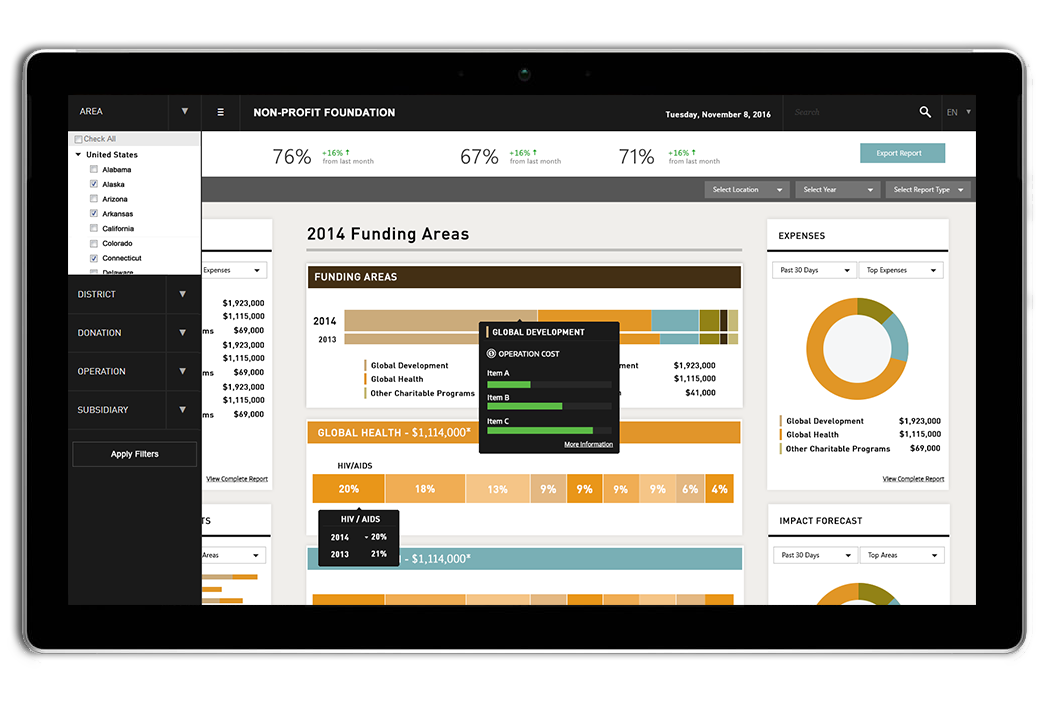
You are the Sales & Operations Director and want to see how funds are dispersed throughout he world. The dashboard shows a detailed breakdown of the individual expenses and be able to compare it from previous years. This would help the nonprofit visually see how they are trending year to year, from donations to expenses.
The data gathered in this dashboard was extracted from annual reports from a nonprofit.

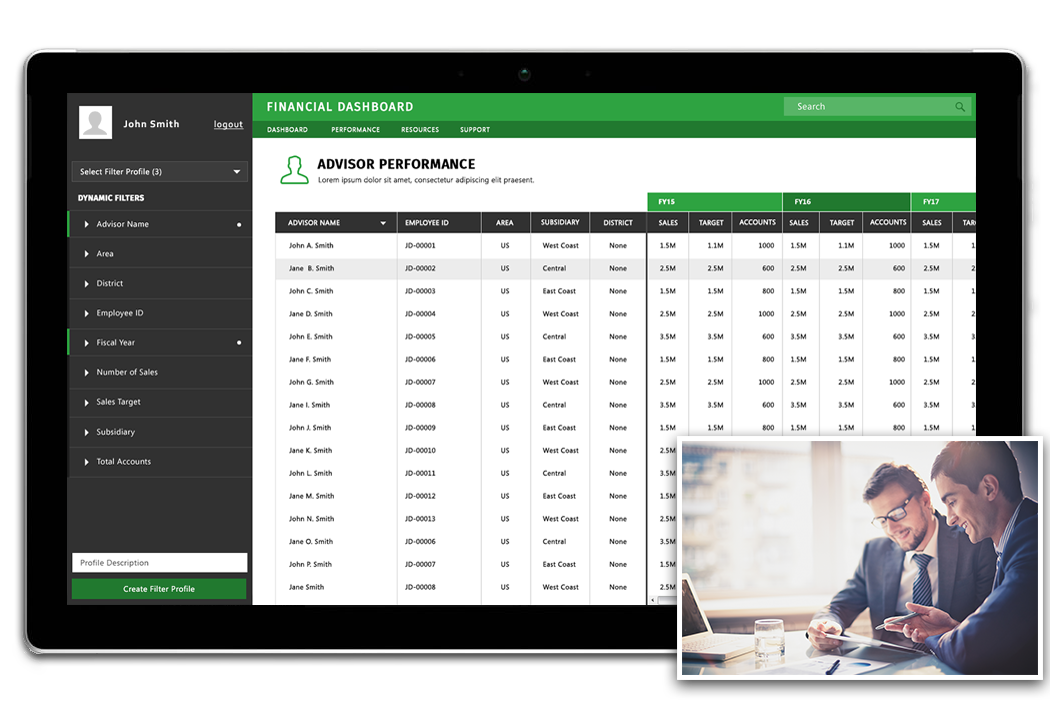
You are a regional manager of a large investment firm. You been tasked to report back on which region and into branches are outperforming and under performing. With various filters available, you are able to sort through the large data set and dive deep down to the individual advisor's performances. From the insights, you're able to report back on the different variable and environment that contributed to the overall performance of each region and branch on a quarterly basis.

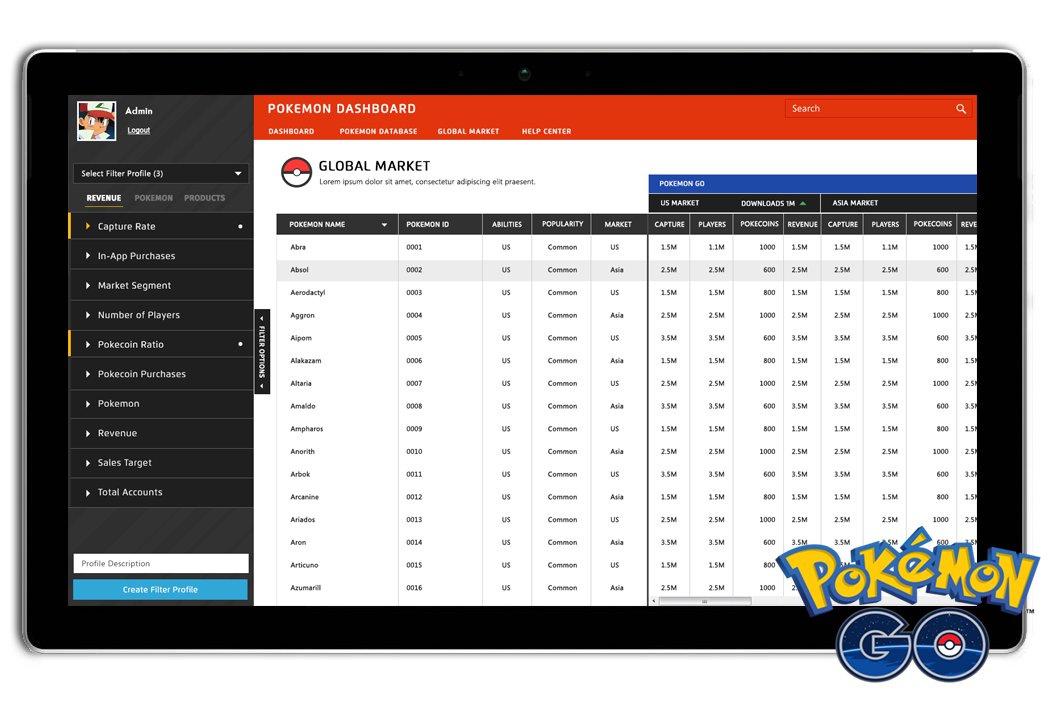
You are a product creator who wants additional knowledge by tracking the in-game economy and unit deployments. Through a dashboard, you are able to see the data that influences the current market trend in different parts of the world. This allows you to gain insight on capture rate, control the number of releases, player density, in-game currencies and purchases, etc. and influence how the game operates moving forward.
Not affiliated with Pokemon GO or Nintendo. This is a purely a concept.